ALF-141 – Adversarial Harm Rating (AHR)
Version 0.1
Date: August 2026
Status: Draft excerpt — forms part of the future ALF-140 (Measurement)
standard.
Supporting Materials
The supporting code and analysis for this paper are available below.
- Download the PDF
- Download the model notebook
- Download the worked examples notebook
- Download the Python implementation
Author’s Note
While tackling safety adversaries, organizations frequently have to make tough decisions on prioritization – there is often more harm than can be effectively tackled all at once. What helps make and communicate these decisions is a consistent and flexible approach to weighing the harm posed by adversaries. This draft paper proposes an intra-domain (scams, influence operations, etc) model at the macro level which can be adopted and adjusted as required. It forms part of the Adversarial Learning Framework (ALF) and previews some concepts to be further explored in ALF-140 (Measurement). The framework is intended to primarily suit AI labs and digital platform providers which have large user bases. Feedback is welcome at: laurie@lauriehocking.com
1. Executive Summary
The problem
In Trust & Safety, volume is a persistent challenge, there is often more adversarial activity than can be addressed at once. Making and communicating informed prioritization decisions requires a consistent method to weigh the harm posed by adversarial activity. Naive approaches (intuition-based ad-hoc assessments, or simple counts of accounts in a network) may suffice at low maturity, but as defensive functions scale, a more rigorous approach becomes necessary.
What this paper introduces
The Adversarial Harm Rating (AHR) – a flexible model rating harm across three axes: Victim Impact, Scale, and External Pressure. The first two measure impact to victims (individual severity and breadth of exposure); the third measures risk to the organization itself (regulatory, legal, and reputational). The model is designed so that it both preserves this decomposable distinction (separate ratings for the victim and organization focused impact) and provides an approach to combine them into a composite score providing a way to directly compare one adversarial network to another using a single score.
The model is intentionally flexible rather than prescriptive – indicators, boundary-setting methods, and the level of automation are all adaptable to an organization’s size, maturity, and domain, while the three axes and their separation remain constant.
Who should use this
Anyone responsible for prioritizing/triaging/stack-ranking adversarial activity at scale: intelligence and investigations teams prioritizing leads, product teams hardening products against abuse and executive/policy stakeholders who need a methodology to help them focus on the most severe abuse within a given harm domain.
Where to find the model
The model itself, its five steps, the lookup table, and boundary-setting method is set out in full in Section 3 (The Adversarial Harm Rating Model). A ready-to-use Python reference implementation, structured to match those same five steps, is available as an accompanying Jupyter notebook (ahr_model.ipynb), with two fully worked hypothetical examples (one for an AI lab scams scenario and the other for a social media influence operation) – (AHR — Worked Hypothetical Examples) demonstrating it end to end. Both can be adopted and adapted directly, see Section 3 and the accompanying notebooks to get started.
2. Design Principles
Key design principles that this model addresses are examined in greater detail below, however by means of introduction they are as follows:
-
Harm comprehensiveness – coverage over three key axes: victim impact, scale and external pressure
-
Automation and quantitative measurement: if a full scale investigation is required to establish the harm rating then the resources have already been exhausted during the triage itself – the aim is to make the initial assessment fast and efficient
-
Explainability: we should be able to decompose a rating to its contributing elements to understand how we arrived at that specific rating
-
Flexibility: the model should be easily adaptable across organizations and problem domains (including both human and AI generated harm)
Harm Comprehensiveness - Harm Axes
The harm posed by safety adversaries typically falls across three primary axes which this model aims to capture which are explored further below:
-
Victim Impact
-
Scale
-
External Pressure
Victim Impact
Because safety harm types are user centric we should take into account the degree of impact that a harm has on a given victim. This axis will have to vary according to the harm sub-type and for some domains there may already be suitable models that can be used to infer individual severity (for example in the case of CSAM the ABC Category System). For others it may be necessary to examine and categorize common harm patterns in order to be able to prioritize those which are understood to be of higher severity. One example of this could be within scams where we consider two types of scam:
1) A victim purchases an item for 20 dollars which is never delivered (and never existed)
2) A victim loses their life’s savings to an investment scam and ends up losing their house
Purely in terms of impact on the victim, scam ‘b’ is the more severe and should be prioritized accordingly.
Example indicators:
-
Estimated monetary loss (e.g. associated with scam type)
-
Sentencing guidelines for similar criminal offenses
-
CSAM categorizations
-
Terrorism recruitment success rate
-
Radicalization success rate
Note: these indicators are applied at the harm type level and for this axis scale should not be included. So in the case of the terrorism recruitment success rate example, the tiering would be made on the tactics used and their perceived likelihood of success (e.g. providing means to facilitate travel may be a stronger indicator than simply providing generic ideological encouragement), rather than trying to measure the scale of success (total individuals likely recruited - which would be a scale measurement).
Scale
A factor which is especially relevant within digital platforms is that of scale - i.e. accounting for the quantity of harm being generated. This is a measure of ‘breadth’ rather than depth and examples of measures used could include the number of potential victims impacted (perhaps receiving a scam message) or the volume of exposure of a piece of disinformation content (perhaps measured in terms of total views). Even though the discussion here is that of exposure, some decisions would need to be made in terms of what should count as an incident of exposure - for example in the case of a scam message with a link, at what point should one record it as an exposure:
1) Receiving the message
2) Reading the message
3) Clicking the link from the message
4) By ascertaining real world loss as a result of clicking the link
Some of this will be dictated by measurement practicalities and telemetry visibility however even assuming perfect visibility there is a decision to make on what one is trying to measure for scale - is it the exposure to potential harm: “the user received a message that they likely thought was a scam so they didn’t click on the link” or is the objective rather to measure the scale of likely harm caused: “we only count the users who clicked on the link as they are the only ones who potentially became victim of the scam”. Such implementation decisions may vary slightly across harm types (e.g. for a scam one becomes a victim when one loses money whereas for influence operations exposure itself may be sufficient to cause the intended harm) but ultimately, it is important to be clear what is being measured - the exposure/perception of harm or realized harm.
Example indicators:
-
Total recipients of messages
-
Total viewers of offending content
-
Ad spend (by adversary)
Note: measuring scale by numbers of on platform assets or content (e.g. accounts/videos/posts) may be less representative of realized harm, as the entities themselves don’t directly cause the harm - it is the exposure/interaction with potential victims which does. For example a large network of connected accounts may be relatively poor at generating traction/views, whereas a single well optimized asset may outperform the larger network and thus be more harmful in terms of scale.
External Pressure
This axis reflects how external pressure may affect the risk posed to the company as it pertains to a given domain or jurisdiction. The sources of such pressure are varied and can include: legislation and regulation, civil/private litigation and media pressure. The target of such pressure also varies: the geographical jurisdiction, victim status (in the case of high-profile individuals), and to some extent, harm type (more on the latter below). This axis in particular is likely to require significant input from (and likely ownership by) the policy and legal functions within an organization. This is also the axis which is most susceptible to change over time as government focus and legislation evolves and media interests in given topics ebb and flow.
The methodology of measurement can include both quantitative and qualitative indicators however the AHR model proposes that the External Pressure axis be compressed into a discrete tiered output as follows:
-
Low - no known reason for elevated risk
-
Medium - emerging elevation of risk
-
High - active sustained pressure requiring ongoing support (likely centering on legal and policy functions)
-
Critical - subject to high-profile action likely to cause substantial financial/reputational risk to the organization
It should be noted that there is some overlap in terms of the factors accounted for between External Pressure and Victim Impact when we consider the harm sub-type. When considering victim impact we are ascertaining how we should rate the severity of a specific harm-subtype in terms of the effect on an individual victim, whereas under External Pressure we may be under specific pressure for a given harm sub-type either globally (more likely in a case where the pressure source is media reporting), or (more commonly) within a specific jurisdiction (where a regulator is particularly concerned about a given sub-harm type or threat actor).
Example indicators:
-
Total active litigation cases
-
Existence of directly relevant legislation/regulation
-
Volume/level and tone of media reporting
-
Victim status
-
Threat actor
Automation and Quantitative Measurement
One of the primary use cases for the Adversarial Harm Rating Model is being able to effectively triage and prioritise investigative leads. Within digital platforms the challenge of scale means that the more of this triage that can be automated, the more efficient the prioritization will be and thus the more resources will be focused on the highest harm investigations. Especially in high-volume, user reported domains (such as scams) having a quantitative approach to sifting leads is essential (organizations are unlikely to have resources to manually review thousands of leads within a specialized investigation team).
The implementation of this design principle will vary across problem domains but some high level considerations include:
-
Victim impact – where indicators require content review (for example to establish the type of scam), consider whether AI can be deployed to carry out such classification tasks.
-
Scale – this should be relatively easy to measure quantitatively where stored queries can be written in order to establish the size of a connected adversarial network and the associated views/message sends/ad spend etc.
-
External pressure – some of this can be pre-calculated (for instance where a list of jurisdiction<>risk may be prepared and regularly maintained) at which point automation would only be required to ascertain the adversary’s location and then lookup the associated risk rating. However there will be outlier situations where specific escalations occur which will require more qualitative review. The objective should be that a degree of automation should be pursued within this axis even though there will be exceptions.
Explainability
It is important to retain the composite parts that go into calculating a final score/rating. This is more an implementation problem than it is inherently a model design problem but it is sufficiently critical that it is worth capturing here. If an organization only records a final rating for a given lead (e.g. high/critical, or perhaps a score of 96), we want to be able to understand how that rating was reached for the following reasons:
-
Model maturation and improvement – if ratings seem poorly balanced there will be a need to be able to introspect and walk back how the rating was reached in case there are specific improvements that can be made to improve the model’s effectiveness.
-
Defensibility and justification – when a rating is challenged or when the question is asked of “how did we reach this rating?” it will be necessary to be able to deconstruct and explain the rating calculation. This point may be especially pertinent in the case of legal challenge or public inquiry.
One further point on the topic of explainability is that it is recommended that organizations enforce and record version control for their specific implementations of the model. As it is likely to evolve over time, it will be important to know which version of the model was applied to a given adversarial operation, and to be able to refer to how that particular version calculated the rating.
Flexibility
The safety space varies not only across platform/product type (AI labs, social media, service platforms) and organization, but also between harm domains (violent extremism, child safety, scams, etc). In order to balance taking a consistent approach with the flexibility to support case-by-case nuance the model is designed to be inherently flexible. The constants are ensuring that the rating encompasses the three key axes (Victim Impact, Scale and External Pressure), while providing a sliding scale of customization from the indicators used to the level of automation and quantitative vs qualitative approaches.
3. The Adversarial Harm Rating Model
The Adversarial Harm Rating (AHR) Model is flexible both in design and implementation. For several of the steps there are faster to implement, more naive approaches as well as methods grounded in data, there are also some suggested constants built into the model which can be tuned to best fit an organization’s requirements. Here we will step through the model and highlight where such flexibility can be considered.
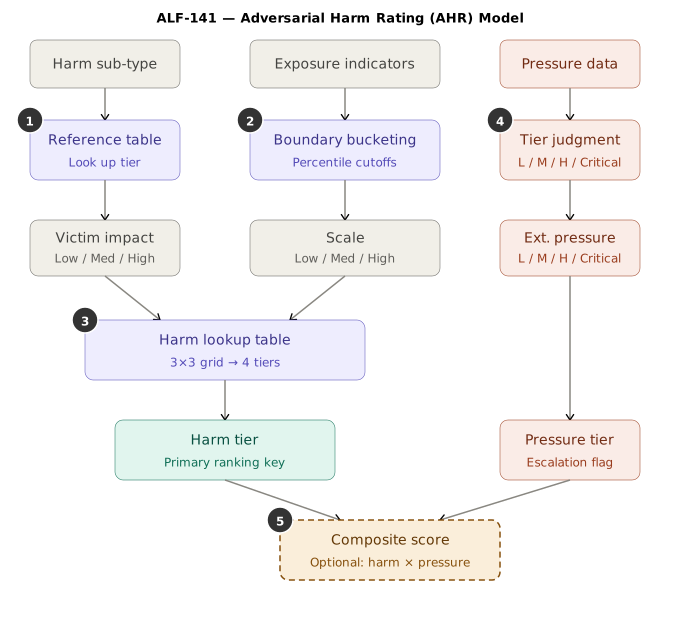
Step 1. Rate Victim Impact: Low/Medium/High
This step requires the construction of a harm domain specific rubric which breaks down common types of abuse into buckets according to the perceived impact on an individual victim. For some harm domains there may already be a system in place while for others one may have to be generated. One example of this could be comparing types of scams where investment scams (where large amounts of money is often ‘invested’) may be classified as High whereas a fake low cost product scam may be low. Such a lookup table for victim impact could be stored as a config file and a lead could be automatically assessed through sampling and AI classification. Where there is a mix of harm sub-types within a given adversarial network there are a few options:
1) Use the mode (most commonly occurring harm sub-type) - recommended
2) Default to highest occurring rating
3) Default to highest occurring weighting provided it reaches a given threshold (e.g. 20% of total network)
A note on categorical vs continuous scale:
It is generally expected that Victim Impact will be derived from categorical data (such as different types of scam) however there may be cases where continuous scaled data can be used. For instance if an organization has visibility into the actual dollar loss totals for a given scam victim, or if the percentage of engagement with a piece of content of an influence operation is considered a proxy for Victim Impact. In cases where continuous indicators are used approaches could include using the general population data of adversarial activity to set percentile boundaries for Low/Medium/High bins (similar to the proposed approach for Scale below).
Output: Low/Medium/High rating for Victim Impact
Step 2. Rate Scale: Low/Medium/High
The first step to calculate the scale is to decide on what indicators you want to count, build those counts and then break them up across bins to derive a scale rating. For an AI lab scale measurement will likely depend on how the AI is being used, if there is agentic use to engage users/send messages then being able to count likely victim totals may be possible, however if the AI is assessed to be used for a ‘create once, distribute often’ use case then knowing how many victims that material reaches will be more tricky without cross-industry partnerships and insight. For social media companies views, message reads and link click-throughs are all atomic examples of potential victim impact (whereas counts of posts or adversary controlled user accounts are not).
Once the exposure indicators are decided upon, the general population distribution needs to be understood so that one can later place a given instance onto that range to understand its position and relative scale tier (low/medium/high). To do this the exposure counts for the general population of adversarial networks are obtained. In order to control for large outliers it’s recommended that the values be log-transformed before applying percentile binning. In this example the model sticks to having three bins - low/medium/high and to achieve this the model defaults to the following bins:
-
Low: 0-60th percentile
-
Medium: 60th-90th percentile
-
High >90th percentile
Once the specific adversarial network has been mapped out and all the counts of atomic victim impact indicators made, the scale rating can be found by placing it in the relevant bin above. This is relatively straightforward where a single indicator is used. However where multiple indicators need to be combined this may be more tricky. In the case of a social media product we may be able to convert indicators into a common type, such as ‘views’ or ‘impressions’, treating a user viewing a post, and advert or a received message as all being equivalent. However if this isn’t acceptable then it may be desirable to explore combining multiple weighted indicators according to their perceived importance.
Output: Low/Medium/High rating for Scale
Step 3. Calculate Victim Harm Score (combining Victim Impact and Scale)
This section uses a straightforward lookup matrix to produce a Victim Harm product rating taking inputs from steps 1 and 2. This table is flexible and can be adapted as needed, for example an organization might decide that for their use case when the scale is low the Victim Harm Score can never rise above Low (perhaps because a different function deals with such cases).
| Low (Victim Impact) | Medium (Victim Impact) | High (Victim Impact) | |
|---|---|---|---|
| Low (Scale) | Low | Low | Medium |
| Medium (Scale) | Low | Medium | High |
| High (Scale) | Medium | High | Critical |
Output: Composite Victim Harm rating as Low/Medium/High combining the Victim Impact and Scale ratings
Step 4. Calculate the External Pressure rating
This step will likely utilize an internal lookup table which will include a (frequently updated) table of jurisdictions and their associated risk profile. If required, a harm sub-type could be baked in e.g. country X is Low, unless the harm sub-type is Y (which is specifically sensitive within that jurisdiction) – in which case the rating is Medium. Once the lookup table is created this step should be able to be run automatically using signals to ascertain the location of the adversary and their prospective victims, along with (if necessary) signals and AI classification to ascertain harm sub-types.
It may also be desirable to use automation to identify high-profile victims (e.g. by querying for specific account flags amongst victims) and potentially to have media monitoring to assess media reporting pressure for a given harm sub-type/region – however often this is where using manual intervention and intuition is more likely warranted and may result in bumping the rating manually (ensuring that the rationale is recorded).
Optionally there may be an opportunity to use data to help directly set jurisdiction ratings, for instance by counting active litigation cases, however this requires further exploration to establish whether it adds sufficient value.
Note: At this point we have completed the assessment stage and we have component ratings which should be recorded before we combine them into a single composite rating. These ratings are as follows:
-
Victim Impact rating
-
Scale rating
-
Victim Harm rating (combining the Victim Impact and Scale)
-
External Pressure rating
Output: Low/Medium/High/Critical External Pressure rating
Step 5. Generate a composite harm rating
To make stack ranking and analysis of large volumes of harm incidents more manageable our final step is to build a composite harm rating as follows:
-
Assign numerical values to our tiers and select the relevant value derived for Victim Harm (step 3): Low = 1, Medium = 2, High = 3
-
Use External Pressure as a multiplier using a fixed set of values (which remain static with a given version of AHR, organization specific): Low = 1.0, Medium = 1.15, High = 1.35, Critical = 1.6
-
Calculate the final composite harm rating by multiplying the Victim Harm rating score with the External Pressure multiplier.
e.g. where Victim Harm is Medium and External Pressure is High: 2 X 1.35 = 2.7
Note that the External Pressure multipliers used can be adapted as required on a per-version basis, however it’s worth considering the following two points:
-
The intervals are intentionally non-linear (e.g. the step between high and critical is intentionally greater than those from low to medium and medium to high). This is due to the expectation that a critical rating will represent a situation requiring an enhanced response that the composite should reflect.
-
The selected multipliers constrain the composite ratings so that an investigation that receives a Victim Harm rating of Low can never be pushed up by the External Pressure multiplier to the level of an investigation which has a Victim Harm rating of Medium. This behavior is possible at the Medium/High boundary however where a Victim Harm Medium (2) and an External Pressure Critical (1.6) gives a composite rating of 3.2 (whereas a Victim Harm rating of High (3) and an External Pressure rating of Low (1.0) returns a composite score of 3). This is a design choice which can be tuned according to need.
4. Applying the Rating
This section provides two illustrative, hypothetical examples where the model is applied using synthetic data. See the accompanying Jupyter Notebook “AHR - Worked Hypothetical Examples” for code/calculations.
AI Lab Example
Scenario: “A series of accounts are being used to generate messages for scammers. The scam type appears to be investment scams targeting the elderly (both factors can form part of the Victim Impact rating), and the indicator used for Scale in this case is the quantity of violating responses. The jurisdiction in question is the UK, which is rated as Medium for External Pressure.”
Victim Impact: this is a categorical case: the harm sub-type (“investment scam targeting elderly”) combines two aggravating factors (scam type + a recognized vulnerable population) and is rated via the reference table rather than a continuous proxy. We treat it as High.
Scale: the organization measures scale by counting violating model responses generated in support of the scam, rather than downstream recipient/view counts (which this AI lab may not have visibility into). Synthetic historical data represents violating-response counts from past incidents of this type, used to derive defensible percentile boundaries rather than a guessed cutoff. This lands the Scale factor as Medium.
Victim Harm: using the harm matrix lookup table (see step 3 under The Adversarial Harm (AHR) Model section) the Victim Impact: High / Scale: Medium combination returns a Victim Harm rating of High.
External Pressure: given directly as Medium (UK jurisdiction) in this hypothetical example. Note that this could be automatically derived where the AI lab maintains a country<>rating lookup table and where the account locations are automatically inferred from signals data.
Composite Harm Rating: The composite harm rating is derived by obtaining the product of the Victim Harm numerical value (High = 3) and the External Pressure multiplier (Medium = 1.15): 3 * 1.15 = 3.45
Social Media Example
Scenario: “A network of 3,000 accounts are posting disinformation content to push a specific civic narrative in support of an upcoming election. The Victim Impact rating used by this organization is the engagement rate (for a given number of views, how much engagement is seen). For Scale, the measure used is the total number of views across all media/content/ads across the complete network.”
Victim Impact: unlike the AI lab example, this organization has no categorical reference table for influence operations sub-types; instead it uses a continuous proxy, engagement rate (engagement ÷ views), on the reasoning that higher engagement per view suggests stronger persuasive effect on those exposed. This demonstrates that the same percentile boundary-setting machinery used for Scale can be reused for Victim Impact when a suitable continuous indicator exists and no categorical reference is available. This example has an average engagement rate of 0.09 which corresponds to a Victim Impact rating of Medium.
Scale: total views across all accounts, content, and ads in the network. For this organization, a large network (3,000 accounts) does not by itself imply high scale, scale is measured by actual exposure, not asset count as this the impact takes place on those viewing the content itself. In this example, 2.3M views lands the Scale rating in the Medium tier.
Victim Harm: using our lookup table a combination of Victim Impact: Medium and Scale: Medium returns a Victim Harm rating of Medium.
External Pressure: not specified in the scenario; set here as High, reflecting the heightened regulatory and media sensitivity typically attached to election-related disinformation in the run-up to a vote. This value is illustrative, not derived, and would ordinarily be ascertained from a lookup table where the country targeted would have an associated risk rating. Similar to the previous example, provided such a lookup table were in place, this value could be automatically ascertained by calculating the location of the target audience (and often the presented location of the adversary’s accounts/on-platform assets).
Composite Harm Rating: The composite harm rating is derived by obtaining the product of the Victim Harm numerical value (Medium = 2) and the External Pressure multiplier (High = 1.35): 2 * 1.35 = 2.7
Note: the examples selected here are standalone and illustrative only. As described in the Limitations section there is no intention here to compare adversarial operations across domains (e.g. comparing a scam operation to an influence operation).
5. Limitations
This approach to harm rating is intended to be intra-harm only, that is one should be able to build a rating framework to compare specific instances of abuse to each other within a given harm type, or perhaps to compare harm sub-types. It is not intended to facilitate inter-harm comparisons. For example the framework should help us when we have to compare a given Influence Operation investigation lead to another to stack rank them, or perhaps to compare common scam types to help us prioritize which we want to focus on; it is not designed to try to trade off scam harm against influence operation harms to decide on resourcing. That being said, some of the factors discussed here are relevant to such a discussion (particularly those under External Pressure) and may be explored as the subject of a later paper.
6. Relationship to the Adversarial Learning Framework (ALF)
This paper is a preview excerpt from the Adversarial Learning Framework (ALF) series, not a standalone standard and will be incorporated as part of the future ALF-140 (Measurement) paper, alongside broader metrics.
The Adversarial Harm Rating is intended as shared input to several other ALF capabilities: it gives investigations and intelligence teams a basis for stack-ranking cases and gives executive governance a defensible way to communicate prioritization decisions.
This remains a v0.1 draft. Feedback that changes the model materially will be reflected in future revisions of this excerpt and folded into ALF-140 when it is formally published.
About the Maintainer
Laurie Hocking has spent a career operating inside adversarial systems from three different vantage points: as a Scotland Yard Detective, investigating real offenders under legal and evidentiary scrutiny; as a Trust & Safety investigator and leader at Meta, working scam networks and coordinated influence operations at platform scale; and as the leader of Meta’s Privacy and AI Red Team. This framework is a synthesis of what that combination has made visible: that the organizations best able to withstand adversarial pressure are not the ones with the most sophisticated point solutions, but the ones that have built a genuine feedback loop between intelligence, investigation, red teaming, and product. The Adversarial Learning Framework, and the papers within it, are offered as a starting point for that conversation, subject to revision as practitioners test it against their own experience.